
How to Compare PC Performance After an Upgrade: FPS, Bottlenecks, GPU Usage, and Benchmarks
A CPU or GPU upgrade is rarely useful just because one benchmark number goes up. What matters is how much performance changed, which metric changed, and whether the before-and-after results were measured under comparable conditions. A move from 60 FPS to 90 FPS, for example, is a 30 FPS gain but a 50% increase. Those are two different ways of describing the same result.
Percentage calculations are useful for comparing FPS, 1% lows, benchmark scores, render times, GPU utilization, and price-to-performance. If you want to check the arithmetic separately, this German-language Prozentrechner can verify percentage increases, decreases, and reverse calculations. The more important step, however, is choosing the correct baseline and making sure the two PC results are actually comparable.
Quick rule: Use the original result as the baseline. Then calculate the change against that value. A percentage is only meaningful when the metric, test conditions, and starting point are clear.
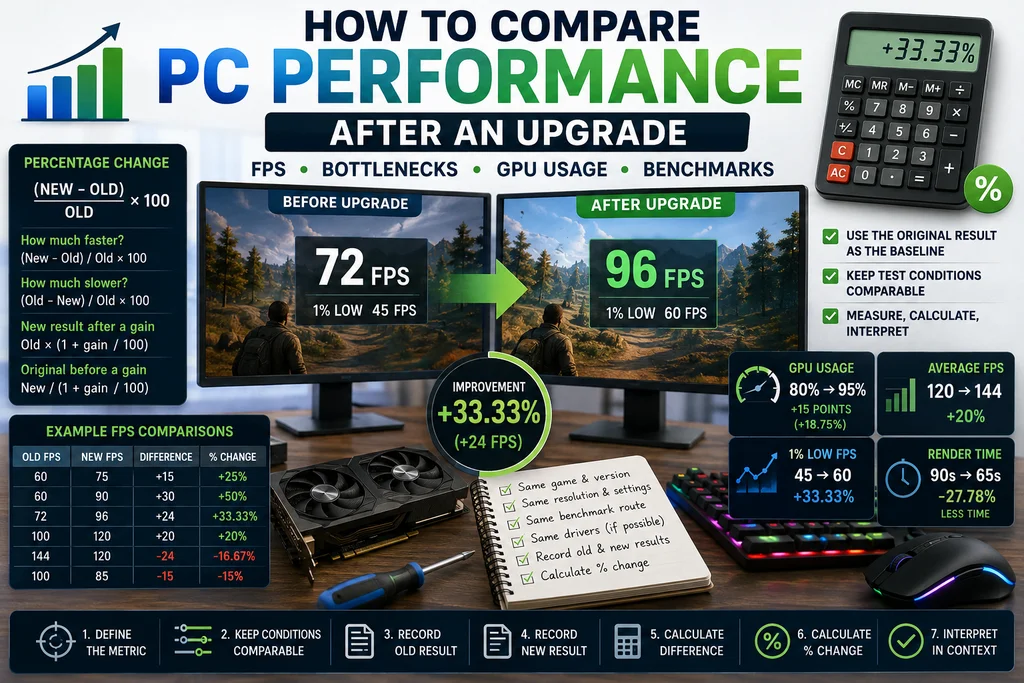
PC performance calculations at a glance
| Question | Formula | Example |
| How much faster? | (New – Old) / Old x 100 | 72 to 96 FPS = +33.33% |
| How much slower? | (Old – New) / Old x 100 | 100 to 85 FPS = -15% |
| New result after a gain | Old x (1 + gain / 100) | 100 FPS + 20% = 120 FPS |
| Original result before a gain | New / (1 + gain / 100) | 144 FPS at +20% came from 120 FPS |
In gaming, frame rate is normally expressed in frames per second (FPS). For a useful upgrade comparison, FPS should be measured alongside context such as resolution, graphics settings, CPU/GPU pairing, and frame-time behavior rather than treated as a standalone score.
1. Start with a comparable benchmark, not the percentage
Before calculating any improvement, make sure the old and new results describe the same workload. A mathematically correct percentage can still be misleading if the tests were run at different resolutions, graphics presets, game versions, power limits, or thermal conditions.
For a basic gaming comparison, keep as many of these variables constant as possible:
● Game and game version
● Resolution and graphics preset
● Benchmark scene or test route
● CPU and GPU pairing, unless one of them is the upgrade being tested
● RAM configuration
● Driver version where practical
● Power and thermal settings
● Background workloads
Why this matters: A move from 100 FPS to 130 FPS is a 30% increase only if those two numbers came from comparable tests. If the second run used lower settings, the percentage no longer isolates the hardware upgrade.
2. How to calculate FPS improvement after an upgrade
The most common PC-performance comparison is a percentage increase in average FPS.
Percentage increase = (New FPS – Old FPS) / Old FPS x 100
Suppose a GPU upgrade changes average performance from 72 FPS to 96 FPS.
Step 1: Find the FPS difference
96 – 72 = 24 FPS
Step 2: Divide by the original result
24 / 72 = 0.3333
Step 3: Convert the result to a percentage
0.3333 x 100 = 33.33%
Result: The upgrade produced a 33.33% increase in average FPS. The gain is 24 FPS, but the percentage gain is 33.33%.
Quick FPS examples
| Old FPS | New FPS | FPS difference | Percentage change |
| 60 | 75 | +15 | +25% |
| 60 | 90 | +30 | +50% |
| 72 | 96 | +24 | +33.33% |
| 100 | 120 | +20 | +20% |
| 144 | 120 | -24 | -16.67% |
| 100 | 85 | -15 | -15% |
Figure 1. Illustrative percentage calculations for several common PC-performance comparisons. These are examples, not measured results from specific hardware.
3. How to calculate a performance decrease
The same baseline rule applies when performance drops after a driver change, thermal issue, game update, or graphics-setting change.
Percentage decrease = (Old value – New value) / Old value x 100
If average FPS falls from 100 to 85:
(100 – 85) / 100 x 100 = 15%
The system is producing 15% fewer frames per second in that test.
4. Why a 20% gain and a 20% loss do not cancel out
Percentage changes use the current value as their baseline. That is why equal percentage gains and losses do not normally return a benchmark to its starting point.
Start at 100 FPS and gain 20%:
100 x 1.20 = 120 FPS
Now reduce 120 FPS by 20%:
120 x 0.80 = 96 FPS
The result is 96 FPS, not 100 FPS, because the 20% decrease is calculated from 120 FPS rather than the original 100 FPS.
How much would 120 FPS need to fall to return to 100 FPS?
20 / 120 x 100 = 16.67%
A 20% gain is therefore reversed by a 16.67% decrease.
5. Average FPS and 1% lows can improve by different amounts
Average FPS is useful, but it does not fully describe how consistent a game feels. Reviewers often pair it with 1% low results to show performance during slower portions of the benchmark.
Consider this illustrative upgrade:
| Metric | Before | After | Percentage change |
| Average FPS | 120 | 144 | +20% |
| 1% low FPS | 45 | 60 | +33.33% |
The average frame rate improved by 20%, while the 1% low improved by 33.33%. Describing the upgrade only as a 20% improvement would miss an important part of the result.
Practical takeaway: When possible, compare average FPS and low-FPS metrics separately. Do not assume every performance metric changed by the same percentage.
6. Bottleneck percentage is not the same as FPS loss
A bottleneck calculator and a benchmark answer different questions. A calculator estimates whether one component may limit another under a set of assumptions, while a benchmark measures what happened in a specific workload.
The Bottleneck Calculator on this site presents percentage-based results to help users judge CPU/GPU balance, while also noting that drivers, resolution, hardware differences, and software behavior can change real-world performance.
Do not translate the numbers directly: A 10% bottleneck estimate does not automatically mean 10% fewer FPS. The bottleneck result is a model estimate; an FPS percentage change must come from measured before-and-after frame-rate data.
Example: measured FPS loss
If one comparable system produces 100 FPS and another produces 90 FPS in the same benchmark, the observed change is:
(100 – 90) / 100 x 100 = 10%
That is a measured 10% FPS decrease. It should not be treated as interchangeable with a calculator showing a 10% bottleneck estimate.
7. GPU usage: percentage points and percentage change are different
Metrics already expressed as percentages need extra care. Suppose GPU utilization rises from 80% to 95%.
The direct difference is:
95% – 80% = 15 percentage points
The relative change compared with the original 80% is:
(95 – 80) / 80 x 100 = 18.75%
| Measure | Result |
| Original GPU utilization | 80% |
| New GPU utilization | 95% |
| Change in percentage points | +15 points |
| Relative percentage change | +18.75% |
Both statements are mathematically valid, but they describe different things. In technical writing, saying “GPU utilization rose by 15 percentage points” is usually clearer when comparing two utilization percentages directly.
8. Higher GPU usage does not automatically mean higher performance
Utilization is not a universal performance score. A GPU running at 95% rather than 70% is being used more heavily, but FPS, frame time, or workload completion time still needs to be measured separately.
High GPU usage can be normal in a GPU-limited game. Lower GPU usage can occur because of a CPU limit, frame-rate cap, engine behavior, low graphics settings, or another system constraint. That is why utilization data is most useful when paired with actual performance measurements.
9. Benchmark scores can be compared with the same percentage formula
Synthetic and application benchmark scores can also be compared with the standard percentage-change formula, as long as the benchmark version and test conditions are comparable.
Suppose a system moves from 12,500 points to 15,800 points:
(15,800 – 12,500) / 12,500 x 100 = 26.4%
Result: The benchmark score is 26.4% higher.
A computer benchmark is designed to compare performance under a defined workload. However, a 26.4% higher synthetic score does not guarantee 26.4% more FPS in every game because different workloads can stress different parts of the system.
10. FPS and frame time move in opposite directions
FPS measures how many frames are produced each second. Frame time measures how long each frame takes to produce. Higher FPS is desirable, while lower frame time is desirable.
Approximate frame time in milliseconds = 1,000 / FPS
| FPS | Approximate frame time |
| 30 | 33.33 ms |
| 60 | 16.67 ms |
| 100 | 10.00 ms |
| 120 | 8.33 ms |
| 144 | 6.94 ms |
| 240 | 4.17 ms |
Why a 50% FPS gain is not a 50% frame-time reduction
Going from 60 FPS to 90 FPS is a 50% FPS increase:
(90 – 60) / 60 x 100 = 50%
But frame time falls from approximately 16.67 ms to 11.11 ms:
(16.67 – 11.11) / 16.67 x 100 ≈ 33.35%
The same performance change can therefore be described as a 50% increase in FPS or roughly a 33.3% reduction in frame time. Always name the metric.
11. Render-time improvements need careful wording
Productivity benchmarks often measure how long a task takes rather than how many frames are produced. In that case, a lower result is better.
Suppose a render falls from 90 seconds to 65 seconds.
(90 – 65) / 90 x 100 = 27.78%
The render takes 27.78% less time.
If you convert the same result into throughput, the relationship is different because completing the same task in less time means more work can be completed per unit of time. For most readers, “27.78% less render time” is the clearest description because it directly matches the measured metric.
12. Price-to-performance can change less than raw FPS
A faster GPU is not necessarily a better-value upgrade. Compare both performance and price when budget matters.
Illustrative example:
| Metric | GPU A | GPU B | Change |
| Price | $400 | $500 | +25% |
| Average FPS | 80 | 110 | +37.5% |
| FPS per dollar | 0.20 | 0.22 | +10% |
GPU B is 37.5% faster in this example, but it costs 25% more. Its FPS-per-dollar metric improves by only 10%. That can still be worthwhile, but it is a different conclusion from “37.5% faster.”
13. How much improvement do you need to hit a target FPS?
Percentage calculations can also help before an upgrade. If your current system produces 75 FPS and your target is 120 FPS:
(120 – 75) / 75 x 100 = 60%
You need a 60% increase in overall FPS to reach the target under the same test conditions. That does not mean one component alone must be 60% faster, because the limiting component may change as the system is upgraded.
14. How to recover the original result from a claimed improvement
Sometimes a review gives the new result and a percentage gain but does not show the old result immediately.
If 144 FPS is described as 20% faster than the previous result:
Original FPS = 144 / 1.20 = 120 FPS
This reverse calculation is useful when checking summary charts or marketing claims.
15. Common mistakes in PC performance percentage comparisons
Using the new result as the denominator: Going from 80 FPS to 100 FPS is 20 / 80 x 100 = 25%, not 20 / 100 x 100.
Treating the FPS difference as the percentage: 72 to 96 FPS is a 24 FPS gain, but a 33.33% increase.
Confusing percentage points with relative change: 80% GPU usage to 95% is +15 percentage points and +18.75% relative change.
Treating a bottleneck score as an FPS penalty: A calculator estimate and a measured benchmark result are different metrics.
Comparing different test conditions: A correct formula cannot fix an apples-to-oranges benchmark.
Ignoring whether higher or lower is better: Higher FPS is better; lower frame time or render time is better.
Reporting false precision: If normal benchmark variance is several FPS, four decimal places in the percentage do not add useful accuracy.
A practical workflow for comparing two PC configurations
1. Define the metric: Choose FPS, 1% lows, frame time, benchmark score, render time, utilization, power, or price-to-performance.
2. Keep conditions comparable: Use the same workload, resolution, quality settings, and test method whenever possible.
3. Record the old result: This is the baseline and normally becomes the denominator.
4. Record the new result: Use the result after the upgrade or change.
5. Calculate the absolute difference: New value minus old value.
6. Calculate the percentage change: Difference divided by the old value, multiplied by 100.
7. Interpret the result in context: Check whether the gain is meaningful, repeatable, and linked to the component you changed.
PC comparison worksheet
| Question | What to record |
| What changed? | CPU, GPU, RAM, driver, settings, cooling, or other variable |
| What stayed constant? | Resolution, game, preset, test route, other hardware |
| Old result | Baseline value |
| New result | Result after the change |
| Supporting metric | 1% lows, frame time, power, temperature, utilization |
| Practical conclusion | Did the upgrade improve the experience enough to justify the cost? |
Final takeaway: compare the metric, not just the percentage
Percentage changes put benchmark gains on a common scale, but they are only useful when the tests are comparable and the metric is clearly named.
Use the original result as the baseline. For gaming, pair average FPS with low-FPS or frame-time data where possible. For productivity, compare completion time or throughput. For hardware value, add price-to-performance. Treat bottleneck estimates as guidance alongside real benchmark data, not as guaranteed FPS loss.
Simple rule to remember: Measure first, calculate second, interpret third. The percentage is useful only when the underlying comparison is sound.